How do I get the correct totals in my Power BI table?
This is such a common problem, and you are going to find a hundred blog articles about this. But here is my take on it.
Your dataset
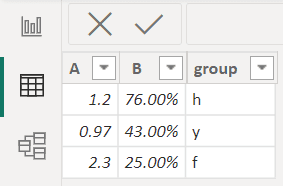
Lets say you have a dataset that looks like this
| group | A | B |
|---|---|---|
| h | 1.2 | 0.76 |
| y | 0.97 | 0.43 |
| f | 2.3 | 0.25 |
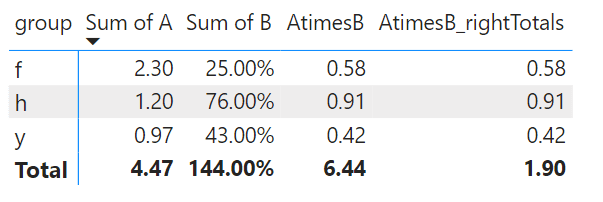
Where B represents the percentage. So in Power BI it might look this image below
First do a simple A times B
AtimesB = SUM(Awesometbl[A])*SUM(Awesometbl[B])
Then do a HASONEVALUE trick
Here is the DAX forumla you need
AtimesB_rightTotals = IF(HASONEVALUE(Awesometbl[group]),
                    [AtimesB],
            SUMX(VALUES(Awesometbl[group]),[AtimesB])
    )
Your table will look like this, where you have the first DAX formula “AtimesB” that is correct for each individual row, but is not correct in the Total. Then you will see the “AtimesB_rightTotals” that has both the correct line calculations as well as the correct sub totals.
0.58 + 0.91 + 0.42 is indeed equal to 1.90